The dashboard is the first page you'll see when entering the owner panel. It shows your studio's most important metrics in a single view - no need to click through multiple pages.
Summary tiles
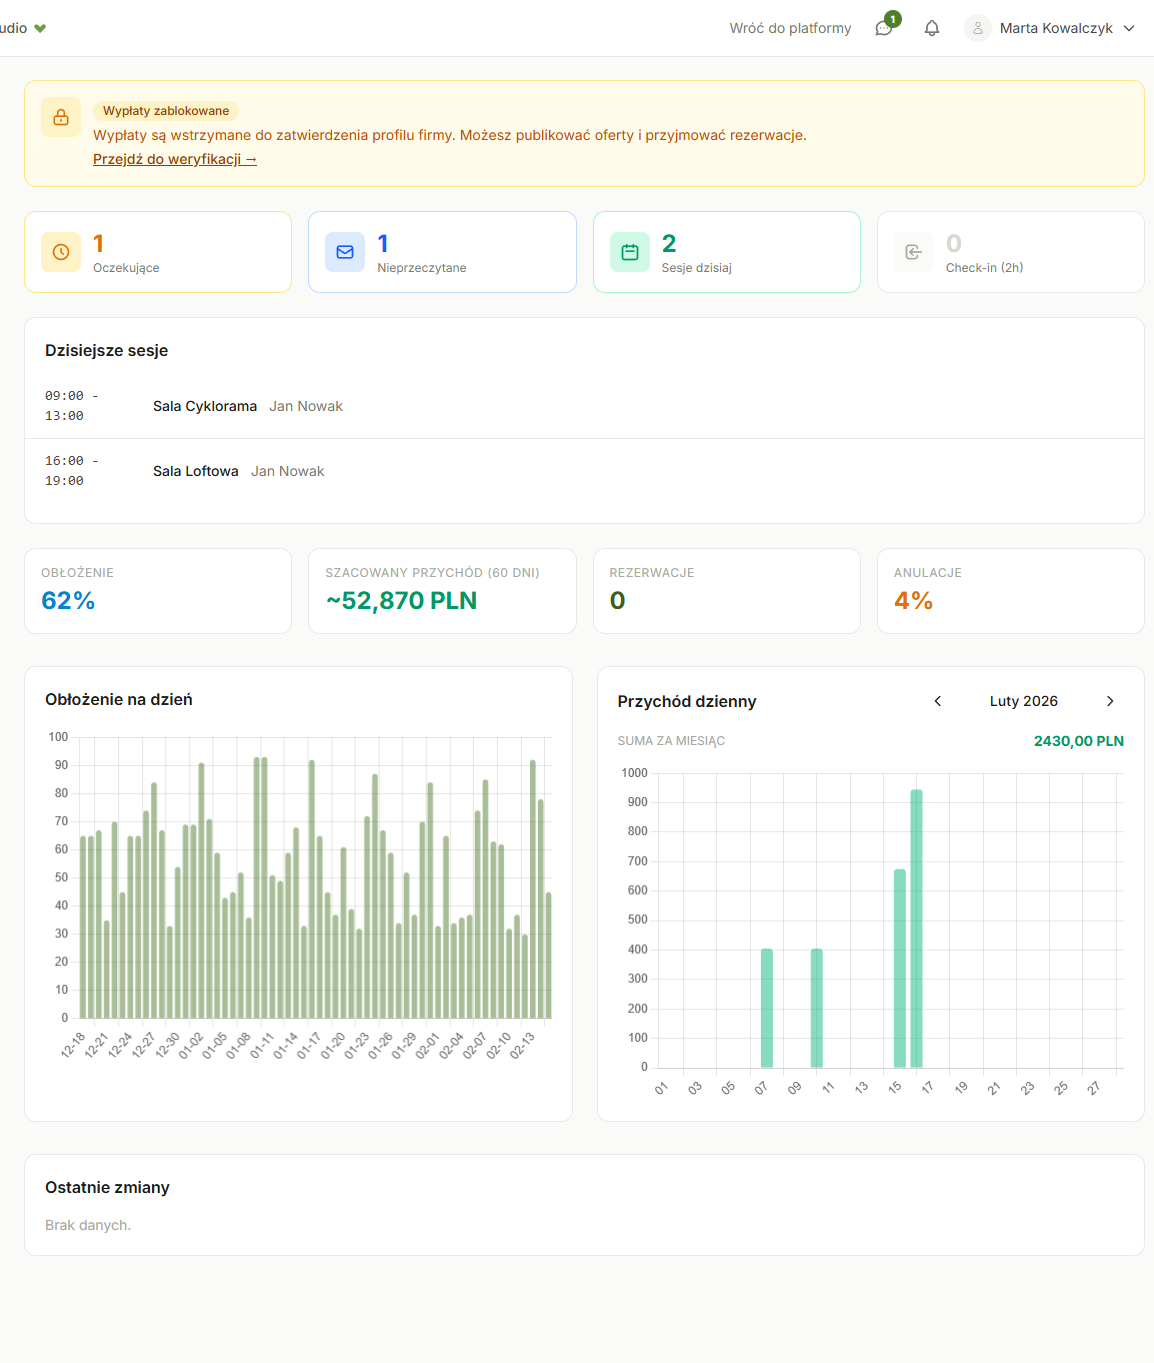
At the top of the dashboard, you'll find four tiles with key numbers:
- Occupancy - percentage of booked hours in the current month. If you have 100 available hours and 40 booked, occupancy is 40%
- Estimated revenue (60 days) - revenue forecast for the next 60 days, calculated based on current occupancy and your pricing
- Bookings - number of active bookings (confirmed and pending)
- Cancellations - percentage of cancelled bookings in the current month
Charts
Below the tiles you'll find two charts:
Daily occupancy
Shows how occupancy looked for individual days over the last 60 days. Helps you spot trends - e.g., that weekends have higher occupancy than weekdays.
Daily revenue
Chart showing actual booking revenue per day. Use the arrows on the sides to switch between months (current plus or minus two). The revenue total for the selected month is displayed above the chart.
Tables
- Rooms - occupancy - occupancy comparison across rooms. Quickly see which room is most popular
- Recent changes - log of recent events: new bookings, cancellations, calendar changes
Common questions
Why does estimated revenue differ from actual?
Estimated revenue is a forecast considering future bookings and historical trends. Actual revenue is available in the Finance section.
How often does data refresh?
Tiles and charts update every time you visit the dashboard. Analytical data (estimated revenue) is recalculated periodically.
I see 0% occupancy, what's wrong?
If you're just starting out, that's normal - occupancy will increase after your first bookings. Also check that your rooms are published and have pricing set up.
Was this article helpful?
What could we improve?
Thanks! Your feedback will help us improve this article.